[ad_1]
Bitcoin price is still attempting a breakout that would see it resume the anticipated bullish wave above $30,000. However, with the crypto market deprived of adequate liquidity to rally, consolidation between $29,000 and $30,000 is taking precedence.
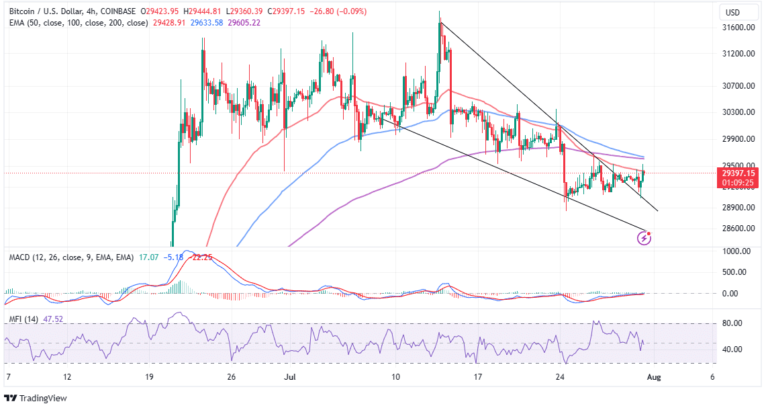
This analysis will evaluate the potential scenario in BTC and what forces are likely to invalidate it. While Bitcoin price broke out the falling wedge pattern discussed on Friday, it only made it slightly above $29,500 such that it is exchanging hands at $29,408 on Monday – as investors prepare to usher in the European session.
Bitcoin Price Steady Despite Curve Exploit
Bitcoin price managed to stay calm as the crypto market struggled to digest the exploit on the stablecoin exchange Curve, which has risked as much as $100 million. According to a report by CoinDesk, the hack took advantage of a “re-entrancy” bug in the platform’s programming language referred to as Vyper.
Meanwhile, Bitcoin is trading at $29,393 after facing another rejection from highs slightly above $29,500. The resistance highlighted by the 50-day Exponential Moving Average (EMA) (red) at $29,428 limits price movement on the upside, making the climb above $30,000 an uphill task.
It is plausible for Bitcoin price may roll back to support at $29,000, and sweep fresh liquidity before resuming the uptrend.
Investors may want to hold onto their long positions in BTC knowing that the Moving Average Convergence Divergence (MACD) dons a buy signal. Movement above the mean line (0.00) would reinforce the buy signal, presented when the blue MACD line crossed above the red signal line.

Since the falling wedge pattern breakout is lagging below $30,000, a retest of the descending trendline, or $29,000 would go a long way to keep investor interest intact.
Popular crypto analyst Captain Faibik highlights a broadening formation on the 12-hour chart, which revealed the possibility of a “potentially substantial up to 10% bullish wave.”
$BTC Broadening Formation (12h) 📈
I firmly anticipate a Potentially Substantial Up to 10% Bullish Wave .#Crypto #Bitcoin #BTC pic.twitter.com/nPij72KegM
— Captain Faibik (@CryptoFaibik) July 31, 2023
However, traders must be cautious, keeping in mind the 100-day EMA (in blue) may flip beneath the 200-day EMA (purple) thus confirming a death cross pattern. Unlike a golden cross, this is a bearish pattern, which implies that the path with the least resistance is to the downside.
As long as Bitcoin holds above $29,000, investors should remain confident that a breakout is coming soon and may propel BTC to $35,000. However, extended declines to $28,000 while they may offer an opportunity for investors to buy lower-priced BTC coins, they could cause panic, culminating in more losses to $25,000.
Related Articles
The presented content may include the personal opinion of the author and is subject to market condition. Do your market research before investing in cryptocurrencies. The author or the publication does not hold any responsibility for your personal financial loss.
[ad_2]
Source link