[ad_1]
BTC price response to the United States Consumer Price Index (CPI) which rose by 0.6%, beating economists’ expectations and a 0.4% increase from July’s 0.2%, continues to shock many. Bitcoin live price managed to reclaim support at $26,000 and is currently pushing for gains above $27,000 where bulls will be free from a multi-week range channel.
CPI inflation climbed to 3.7% on a year-over-year basis, exceeding the market watchers’ forecast of 3.6% as well as July’s 3.2%.
The US economy posted a 0.3% increase in the Core CPI (excluding energy and food prices) compared to expectations of 0.2% and a 0.2% increase in July. On a year-over-year basis, the Core CPI dropped to 4.3%, matching economists’ projections and a significant drop from July’s 4.7%.
BTC Price Bullish Outlook Post CPI Data Release
Bitcoin’s positive reaction to the CPI data has seen a general bullish flip across the market, with capitalization rising by 1.1% almost to cross the $1.1 trillion market. BTC accounts for more than half of the crypto market, with $518 billion.
However, the trading volume has slowed down to $12 billion implying that investors are choosing to hold BTC for long-term speculation as opposed to short-term buying and selling activities.
On-chain data unveiled by Glassnode and Blockware Solutions affirms the long-term holders’ narrative. Bitcoin’s circulating supply dropped by 5.4% this week to hold at 19.4 million.

This supply dip coupled with expectations from the upcoming halving is likely to send BTC price skyrocketing.
“Price is set at the margin, which means those who trade Bitcoin back and forth drive short-term price action.” Blockware Solutions said in an emailed statement. “As supply-side illiquidity continues to increase, as indicated by fewer supply exchanging hands, any demand catalyst will send the price skyrocketing.”
Bitcoin’s circulating supply dormant in the last year currently holds at 70% with investors preferring to buy and hold. According to Glassnode, long-term holders account for 75% of the circulating supply.
BTC Price Charts Way Out Of The Dip
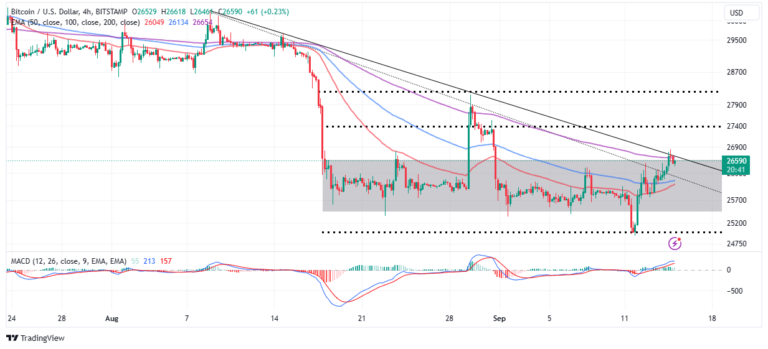
The climb from support at $25,000 decreased the chances of BTC price dropping to seek liquidity at $22,000. Bitcoin’s weakness below $26,000 convinced most analysts that the coin needed to sweep through lower levels to collect liquidity.
However, the ongoing spike above the range channel as shown on the chart reinforces the bullish grip while increasing the probability of a breakout targeting gains above $30,000.
If traders heed the call to buy BTC from the Moving Average Convergence Divergence (MACD) indicator and increase long positions, a price rally will most certainly erupt. Remember, the shrinking circulating supply means demand quickly increases to drive BTC price higher.

Although Bitcoin is not out of the woods yet, a break above the 200-day Exponential Moving Average (EMA) (purple) and subsequently the upper descending trendline, could be the point of no return as BTC price quickly races north to $30,000.
Considering possible profit booking pressure at $27,400 and $28,200 this climb could also be lock-step before moving beyond the psychological resistance at $30,000. On the downside, support areas at $26,000 and $25,000 will stay in place, so if they are weakened, Bitcoin may drop to $22,000 after all.
Related Articles
The presented content may include the personal opinion of the author and is subject to market condition. Do your market research before investing in cryptocurrencies. The author or the publication does not hold any responsibility for your personal financial loss.
[ad_2]
Source link