[ad_1]

- Litecoin price hovers around $63 with the altcoin down over 5% in the past week and 11% over the last 30 days.
- According to CoinGecko, LTC has fallen 84% since hitting its all-time high above $410 in May 2021.
- The downtrend that has seen one of the earliest cryptocurrencies slide out of the top 10 by market cap now has small wallet holders selling as price nears a crucial support area.
Market intelligence and on-chain analytics platform Santiment has highlighted a dip in Litecoin shrimp holders – wallet addresses with less than 1 LTC. These wallets have sold-off over 45,200 LTC, but analysts say this could be a “turnaround.”
“Litecoin has not been lighting social forums on fire with its market value dropping -36% since its April 1st peak. A sudden liquidation of 45.2K net 0.1-1 LTC wallets indicate that small traders are finally capitulating out of the OG crypto asset. Small fish impatiently ‘jumping ship’ is often a turnaround sign for an asset to begin turning bullish once again,” Santiment analysts wrote on X.
76% of Litecoin wallets in loss
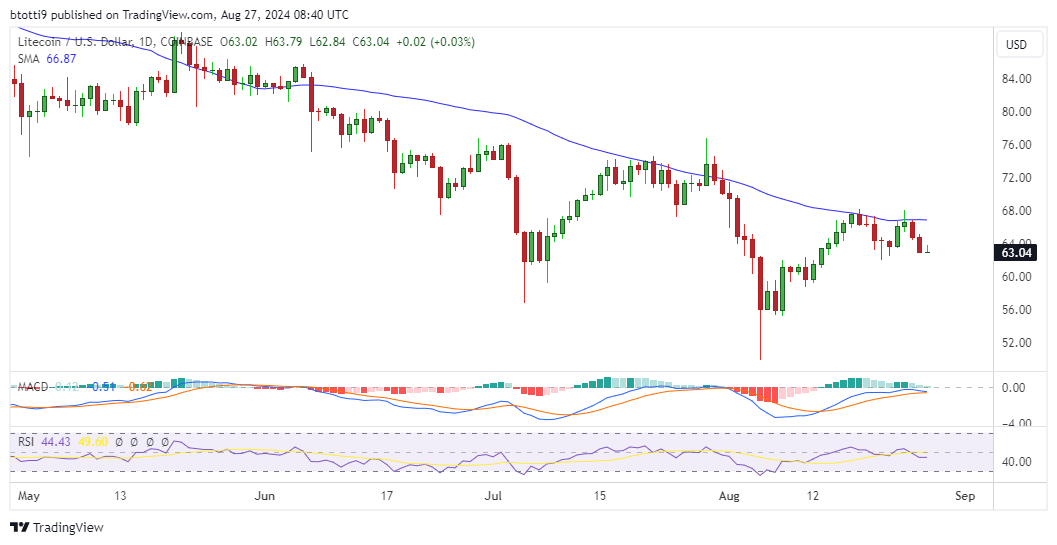
In the past few months, the selling has coincided with price dipping from above $110 in early April. After bouncing from lows of $56 following the crypto crash on August 5, Litecoin is back below $64 and near the major support zone around $60.
Per IntoTheBlock, the In/Out of the Money indicator is largely bearish. About 76% of addresses are in loss at current price and only 18% are in profit. Notably, 22% of addresses have held LTC for less than a year and could be part of the capitulating small holders.
However, 78% of wallets have held the altcoin for more than a year.
Litecoin price chart
0n the daily chart, both the RSI and MACD indicators suggest bears might push Litecoin price lower.

The price is below the 50-day SMA, which could act as the primary resistance level around $66. On the other hand, further weakness could see LTC seek the demand reload zone around $55.
[ad_2]
Source link